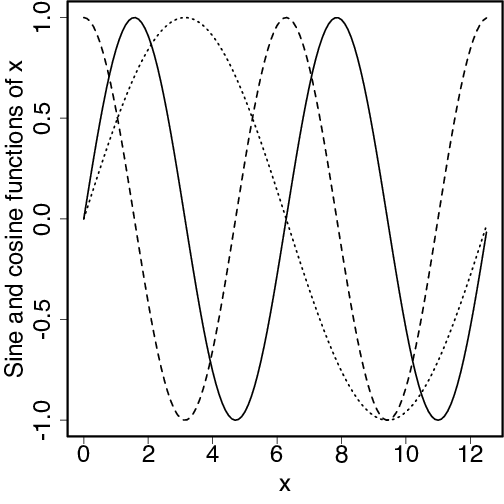
x <- seq(0, 4*pi, .1)
matplot(x, cbind(sin(x), cos(x), sin(x/2)), type="l", lwd=2, col="black",
        ylab="Sine and cosine functions of x")

x1 <- 1:6
y1 <- x1
x2 <- c(1.5, 2.5, 3.5, 4.5, NA, NA)
y2 <- sqrt(x2)
y3 <- 7-x1
y3[4] <- NA
y3
matplot(cbind(x1, x2, x1), cbind(y1, y2, y3),
        type=c("p", "p", "l"), lwd=3)