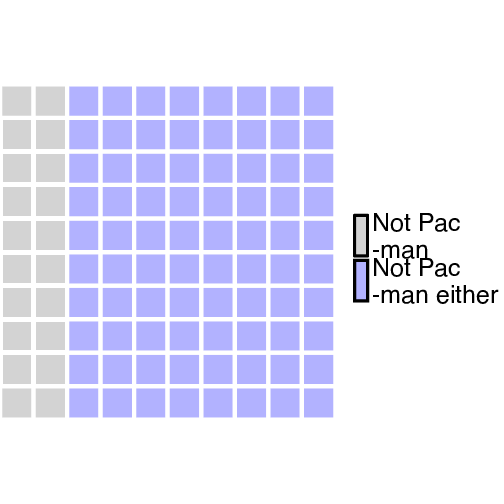
library(waffle)
areas <- c(`Not Pac\n-man`=20,
           `Not Pac\n-man either`=80)
waffle(areas, colors=c("lightgray", myblue)) + theme(legend.text=element_text(size=25))